 Docs
DocsDashboard in Data Analysis

Dashboard Briefly Summarized
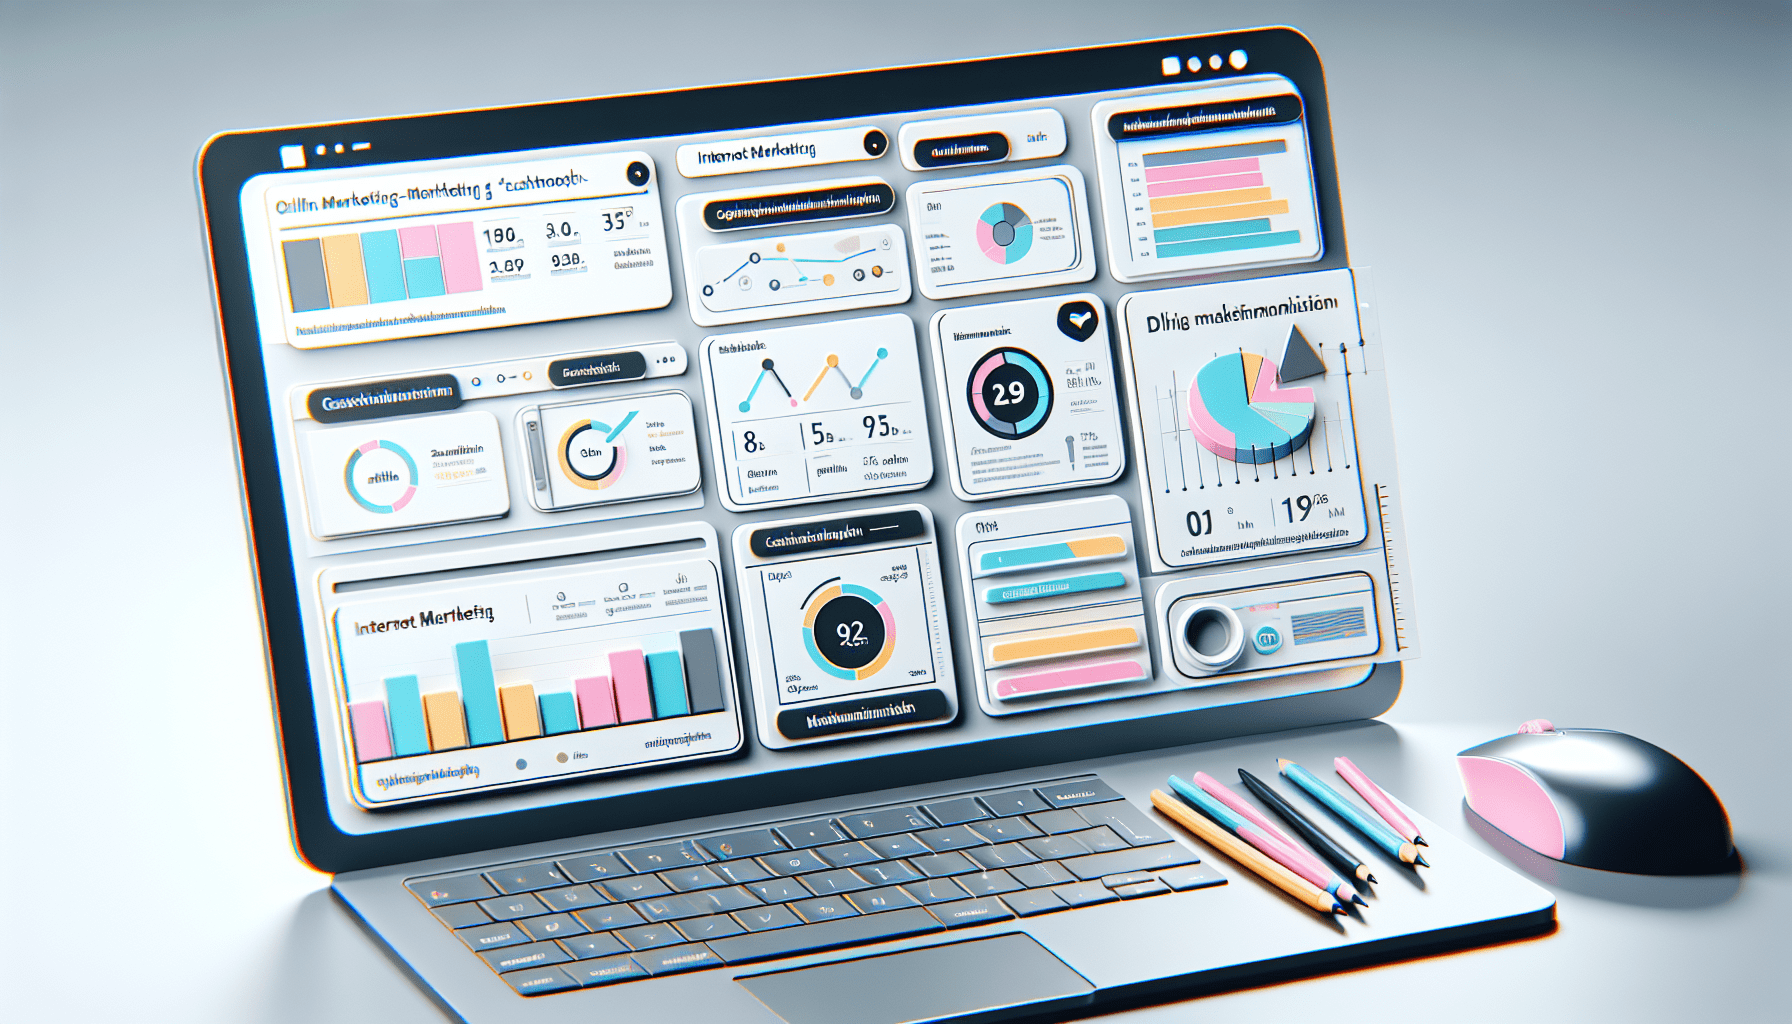
- A dashboard is a visual display of the most important information needed to achieve one or more objectives, consolidated and arranged on a single screen.
- In data analysis, dashboards are used to monitor, measure, and analyze key data points relevant to business or operational goals.
- They often include graphs, charts, and indicators that provide at-a-glance insights into performance and trends.
- Dashboards can be customized to fit the specific needs of different users or departments within an organization.
- They are instrumental in decision-making processes, providing real-time data that can lead to timely and informed actions.
In the realm of data analysis, the term "dashboard" takes on a meaning that transcends its original association with the control panels of vehicles and aircraft. A dashboard in this context is a powerful tool for visualizing data, enabling businesses and organizations to monitor, analyze, and display key performance indicators (KPIs) and other relevant information in an accessible and actionable format. This article will delve into the intricacies of dashboards, their importance in data analysis, and how they are utilized to make informed decisions.
Introduction to Dashboards in Data Analysis
The concept of a dashboard in data analysis is akin to the dashboard of a car. Just as a car's dashboard provides the driver with immediate, easy-to-read information about the vehicle's speed, fuel level, and engine status, a data analysis dashboard presents users with a quick overview of their organization's performance and metrics. This real-time data visualization tool is essential for anyone who needs to keep a finger on the pulse of their business or project.
Dashboards are typically interactive, allowing users to drill down into more detailed views of the data or to filter the information displayed according to specific criteria. They can be designed to serve various functions, from tracking sales and marketing performance to managing supply chains or monitoring IT systems.
The Anatomy of a Dashboard
A well-designed dashboard typically includes several common elements:
- KPIs and Metrics: These are the quantifiable measures that are used to assess the success of an organization or activity in meeting its objectives.
- Charts and Graphs: Visual representations such as bar charts, line graphs, pie charts, and heat maps make complex data more digestible.
- Data Tables: Sometimes, a simple table displaying numbers can be the most effective way to present certain types of information.
- Filters and Controls: These allow users to customize the data they see, often in real-time, to focus on specific areas of interest.
- Alerts and Notifications: These can be set up to notify users when certain thresholds are reached or when attention is needed in specific areas.
The Importance of Dashboards
Dashboards are crucial in the modern data-driven business environment. They provide a quick and easy way to see how a business is performing against its strategic goals. By offering a centralized and interactive means of data analysis, dashboards empower users to:
- Identify Trends: By tracking data over time, dashboards can highlight upward or downward trends that may require action.
- Make Informed Decisions: Real-time data allows for rapid response to emerging issues or opportunities.
- Improve Efficiency: Dashboards can save time by bringing together data from various sources into a single view.
- Enhance Communication: They provide a visual tool that can be used to communicate complex data to stakeholders in an understandable way.
Types of Dashboards
There are generally three types of dashboards used in data analysis:
- Operational Dashboards: These provide a real-time snapshot of processes and operations. They are useful for monitoring the immediate performance of different aspects of a business.
- Analytical Dashboards: These are used for deeper analysis and are often utilized by data analysts to explore trends and generate insights.
- Strategic Dashboards: These are high-level dashboards used by executives and senior managers to track the progress of key strategic objectives.
Designing an Effective Dashboard
Creating an effective dashboard is not just about displaying data; it's about presenting it in a way that is both meaningful and actionable. Here are some best practices for dashboard design:
- Simplicity: A cluttered dashboard can be overwhelming. Include only the most relevant information.
- Visual Hierarchy: Important data should stand out. Use size, color, and placement to guide the viewer's eye.
- Consistency: Keep the design consistent across the dashboard to avoid confusion.
- Interactivity: Allow users to interact with the data, such as filtering views or drilling down for more detail.
- Accessibility: Ensure that the dashboard is accessible to all intended users, including those with disabilities.
Conclusion
Dashboards are an indispensable component of modern data analysis, providing a dynamic and intuitive interface for monitoring, understanding, and acting on data. They transform raw data into actionable insights, facilitating informed decision-making and strategic planning. As businesses continue to navigate an increasingly data-rich environment, the role of dashboards as a tool for competitive advantage becomes ever more critical.
FAQs on Dashboards
Q: What is the primary purpose of a dashboard in data analysis? A: The primary purpose of a dashboard is to present complex data in a simplified, visual format that allows users to monitor, analyze, and make decisions based on key performance metrics and other important information.
Q: Can dashboards be customized for different users? A: Yes, dashboards can and should be customized to meet the specific needs and objectives of different users or departments within an organization.
Q: How often should a dashboard be updated? A: The frequency of updates for a dashboard depends on the nature of the data and the needs of the business. Operational dashboards may require real-time updates, while strategic dashboards might be updated on a monthly or quarterly basis.
Q: Are dashboards only used in business settings? A: While dashboards are commonly used in business, they are also utilized in various other fields such as healthcare, education, government, and non-profits to monitor and analyze relevant data.
Q: What software is used to create dashboards? A: There are many software options for creating dashboards, including specialized business intelligence tools like Tableau, Power BI, and Qlik, as well as more general-purpose software like Excel or Google Sheets.
Sources
- Dashboard
- Google Dashboard
- Google Dashboard
- Dashboard Definition & Meaning - Merriam-Webster
- dashboard
- What is a dashboard? Definitions and uses - Adjust
- Dashboard - Wikipedia
- What is a dashboard? A complete overview - Tableau
- Sign in - Google Accounts
- Dashboard - Zapier
- dashboard - Hootsuite
- Dashboard - Miro