 Docs
DocsDigital Dashboard The Nerve Center of Data Analysis
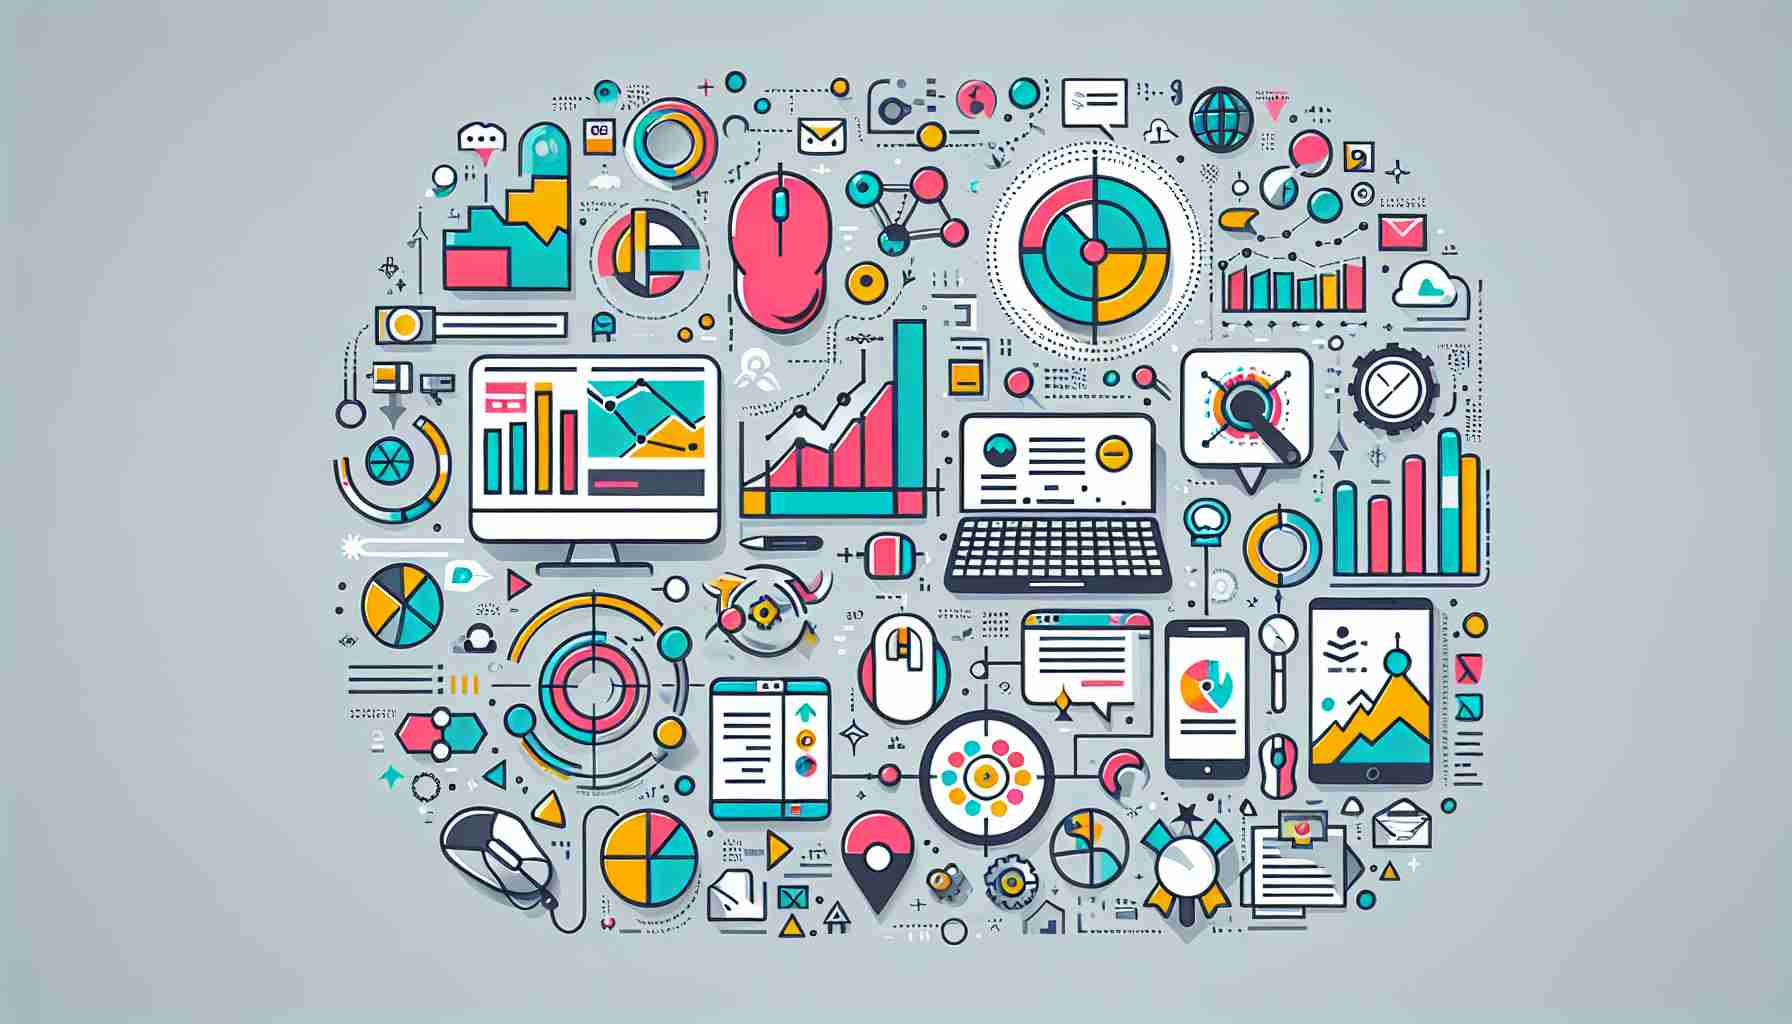
Digital Dashboard Briefly Summarized
- A digital dashboard is a visual interface that displays key performance indicators (KPIs), metrics, and data points for an organization.
- It serves as a centralized platform for real-time data monitoring and analysis, aiding in decision-making processes.
- Digital dashboards are customizable, allowing users to tailor the displayed information to their specific needs and objectives.
- They can integrate data from various sources, including Google Analytics, social media platforms, and internal databases.
- Dashboards are used across different industries and can be strategic, operational, or analytical, depending on the intended use.
The term "dashboard" originates from the automotive industry, referring to the panel that houses the vehicle's controls and instrumentation. However, in the realm of data analysis, a digital dashboard takes on a different significance. It is the modern control panel for businesses and organizations, providing a comprehensive view of performance metrics and real-time data at a glance. This article delves into the intricacies of digital dashboards, their importance in data analysis, and how they have become an indispensable tool for decision-makers.
Introduction to Digital Dashboards
A digital dashboard is an electronic interface that provides a snapshot of the performance of an organization or system. It aggregates and visualizes data from multiple sources, presenting it in an easily digestible format, often through graphs, charts, and indicators. The primary goal of a digital dashboard is to enable quick access to critical information, facilitating informed decisions based on up-to-date data.
The Evolution of Digital Dashboards
The concept of digital dashboards has evolved significantly with advancements in technology. From simple spreadsheets and static reports, dashboards have transformed into dynamic, interactive tools that offer drill-down capabilities and real-time analytics. This evolution has been driven by the increasing volume of data generated by businesses and the need for more sophisticated tools to interpret this data effectively.
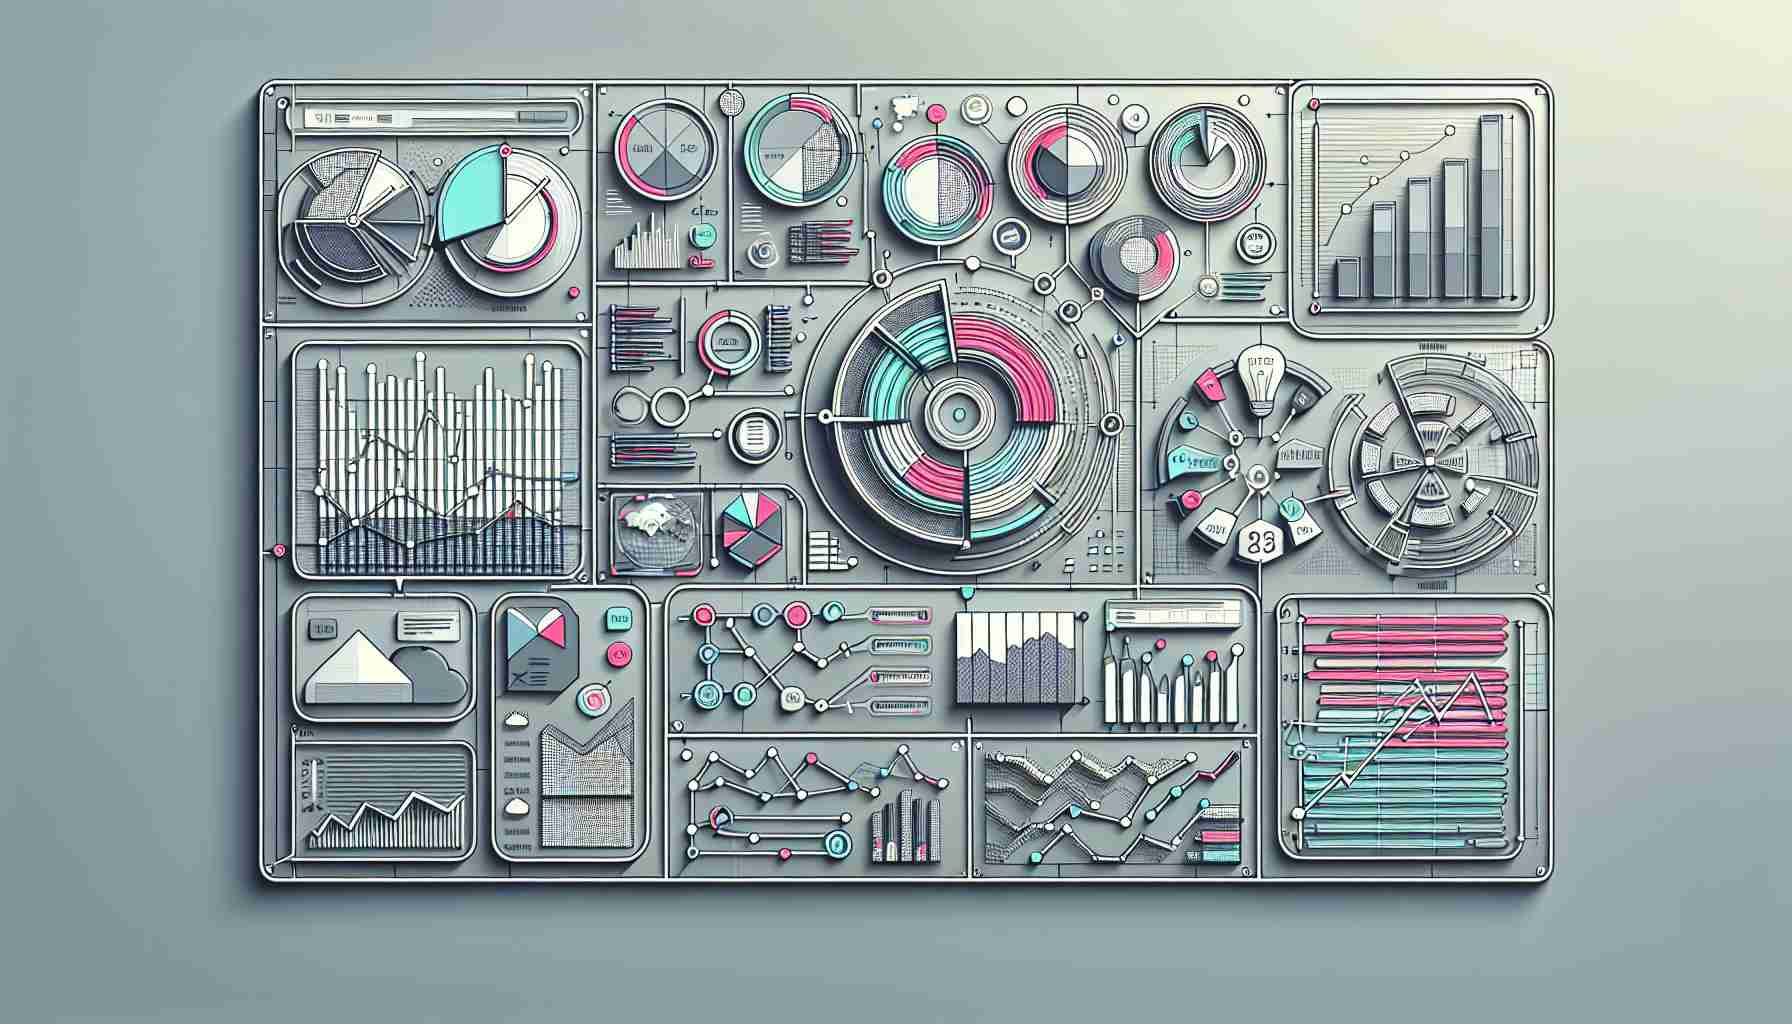
Key Components of a Digital Dashboard
A well-designed digital dashboard typically includes the following elements:
- Real-time Data Visualization: Graphical representations of data that update in real time, allowing users to spot trends and changes as they happen.
- Customization and Personalization: The ability to tailor the dashboard to display relevant metrics that align with the user's role, department, or objectives.
- Interactivity: Features such as filters, sliders, and drop-down menus that allow users to manipulate the data view and focus on specific aspects.
- Data Integration: The capacity to combine data from various sources, providing a unified view of information from across the organization.
- Accessibility: A user-friendly interface that is accessible from multiple devices, including desktops, tablets, and smartphones.
The Importance of Digital Dashboards in Data Analysis
Digital dashboards play a crucial role in data analysis by providing a central location for data monitoring and interpretation. They help organizations to:
- Track Key Performance Indicators (KPIs): Dashboards highlight the most important metrics that reflect the health and performance of the business.
- Identify Trends and Patterns: By visualizing data over time, dashboards can reveal trends that might not be apparent from raw data alone.
- Enhance Decision-Making: With real-time data at their fingertips, decision-makers can respond quickly to changes and make informed choices.
- Improve Efficiency: Dashboards reduce the time and effort required to compile and analyze data, freeing up resources for other tasks.
- Facilitate Communication: Sharing dashboards across teams can improve transparency and ensure everyone is aligned with the organization's goals.
Best Practices for Digital Dashboard Design
To maximize the effectiveness of a digital dashboard, consider the following best practices:
- Start with Clear Objectives: Define what you want to achieve with your dashboard and select metrics that align with those goals.
- Keep It Simple: Avoid clutter by focusing on essential data. Too much information can be overwhelming and counterproductive.
- Use Visual Hierarchy: Prioritize information using size, color, and placement to guide the viewer's attention to the most critical data first.
- Ensure Data Accuracy: Regularly check and maintain the data sources to ensure the information displayed is reliable and up to date.
- Iterate and Evolve: Continuously gather feedback from users and make adjustments to improve the dashboard's utility and user experience.
Conclusion
Digital dashboards have become the linchpin of data-driven decision-making. By consolidating critical data into a single, visually engaging interface, they empower organizations to harness the power of their data. As businesses continue to navigate an increasingly data-rich environment, the role of digital dashboards as the nerve center of data analysis will only grow in significance.
FAQs on Digital Dashboards
What is a digital dashboard? A digital dashboard is a visual interface that displays important data and metrics to help users monitor performance and make informed decisions.
How do digital dashboards aid in data analysis? They provide real-time data visualization, allowing for the quick identification of trends, tracking of KPIs, and enhancement of decision-making processes.
Can digital dashboards be customized? Yes, they are highly customizable, enabling users to focus on the specific metrics and data that are most relevant to their needs.
What types of data can be integrated into a digital dashboard? Digital dashboards can integrate data from a wide range of sources, including internal databases, Google Analytics, social media platforms, and more.
Are digital dashboards only used in business settings? While commonly used in business, digital dashboards are also utilized in various fields such as healthcare, education, and government for data monitoring and analysis.
Sources
- Dashboard
- What is Digital Dashboard? – View 5 Examples - Geckoboard
- Digital Dash Displays | Summit Racing
- Digital Dash - Amazon.com
- 12 of our favorite retro digital dashboards, part one - Hagerty Media
- Dashes - AEM Electronics
- What Is a Digital Dashboard? Learn Its Definition & Examples
- What is a Digital Dashboard? Best Practices, Examples & Templates
- Digital Dash Upgrade - Was it Worth It? - YouTube